Wednesday, November 20, 2013

On Farm Network Part 2

By Jamen Frederick


This is Doug Hendrickson and his son Adam who farm in Warrick County.  They have taken advantage of the On Farm Network guided stalk sampling tests for their reclaimed mine land.  They feel that it is a great tool to assist them in checking their nitrate levels for corn fields. 


Don Ryan is demonstrating the sampling method for On Farm Network where stalk samples are taken from mature corn plants and analyzed for residual nitrate concentration in the stalks.  These samples along with aerial yield maps taken of the fields in summer help farmers assess their cultivation and fertilizer application practices.


 Some OFN sampling is being done strategically on adjacent field areas where cover crops have been planted next to areas where cover crops have not been used to assess differences in nitrate use in corn.


Monday, November 18, 2013

Indiana On-Farm Network

By Sarah Lake

Sarah Lake works for ISDA out of Kokomo and the surrounding four-county area, and is also a leader for the Conservation Reserve Enhancement Program administered by the state. She grew up in the Fort Wayne
area but an interest in environmental science took her to Purdue. After being graduated, she worked in county government before beginning at the ISDA Division of Soil Conservation.


Over 230 farmers across the state of Indiana are conducting nitrogen evaluations on their own farms through the Indiana On-Farm Network Program.  The goal of the evaluations is to collect data from right here in Indiana that will help producers maximize profit while reducing environmental impacts. 
There are 3 tools used to conduct the evaluations- Aerial Photography, Corn Stalk Nitrate Sampling and Replicated Strip Trials.

Aerial Photography is taken of the fields enrolled in the program while the crop is growing. This is done typically in August.  Many things can be seen from this photography including planter set-up issues, fertilizer application issues and drainage problems. 

Corn Stalk Nitrate Sampling is conducted in late September or early October after the corn plant stops taking up nitrogen.  4 sampling locations are chosen in each field, typically in different soil types.  10 corn stalks are collected at each sampling point.  The stalks are tested to see how much nitrogen remained in the stalk after the ear of corn stopped growing.  A high result indicates that more nitrogen was available in the soil than the plant could use in this particular growing season.  A low result indicates there was the potential the corn plant could need more nitrogen than was available that year.


Replicated Strip Trials are set up for producers who would like to see how their yield and efficiency is affected by using different rates of nitrogen, different forms of nitrogen, different nitrogen application timing or different placement of nitrogen.
Tipton County producers wanted to determine the amount of nitrogen remaining in the soil at the time of the Corn Stalk Nitrate Sampling this year.  Soil testing was incorporated into their On-Farm Network program. 


Producers will meet with other participants in their area this winter.  Producers benefit not only from their own data, but also by sharing information with each other.  There are currently 18 On Farm Networks in Indiana.  Over 600 fields are tested totaling over 40,000 acres.


On-Farm Network was developed in 2000 by the Iowa Soybean Association.  The Indiana State Department of Agriculture was awarded a grant in 2010 to develop the program in Indiana.  The Indiana Conservation Partnership along with the Corn Marketing Council and the Soybean Alliance continue to support and grow this program.
For more information regarding Indiana On-Farm Network go to: http://www.in.gov/isda/ofn/.


Monday, November 11, 2013

Working in Watersheds


Hi I’m Sue a Resource Specialist with the Indiana State Department of Agriculture, Division of Soil Conservation. I have worked for the Division of Soil Conservation for 14 years serving the NW Central part of Indiana. I graduated from Purdue University with a Bachelor’s Degree in Natural Resources & Environmental Science, specializing in Aquatic Sciences.

With Soil & Water Conservation being the objective, my position is charged with providing technical and educational services to the local Soil & Water Conservation Districts, other units of government, and landusers.  One day I might find myself surveying for a best management practice on a farm and the next, teaching a group of students how to assess the health of their local waterbody. Conservation work all starts with knowing your watershed and the health of your local streams.
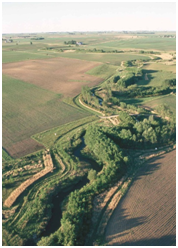
What is a watershed?


A watershed is the total area of land that drains into a particular waterbody (wetland, stream, river, lake, or sea).

Land uses and runoff in a watershed determine the quality of surface water in smaller streams and waterways. They can then influence the water quality of larger streams. For example, point source discharges, urban runoff, runoff from landfills and runoff from agricultural areas may contain sediments, organic material, nutrients, toxic substances, bacteria or other contaminants. When these contaminants or pollutants are present in significant concentrations, they may interfere with some stream uses. So it’s important that watersheds be evaluated and assessed.

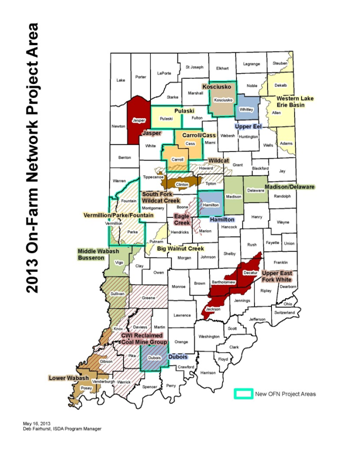
A tool used to evaluate watersheds:
ArcMap is the software I use to delineate or define watershed boundaries and evaluate other parameters for my projects.  This software allows multiple layers of information, such as, topographic data, soils types, landuse data, and hydrology data to be merged together so the watershed could be assessed.


This software also helps me to analyze various attributes of a watershed so that I can provide more specific recommendations 
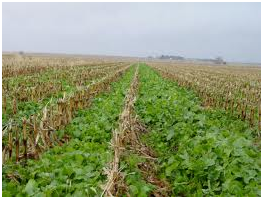
to my clients for implementation of various conservation practices. Practices such as conservation tillage, grassed waterways, rain gardens, rain barrels, 2-stage ditches, water & sediment control basins, vegetative filter strips all help to keep our waterbodies clean.


Biological assessment of your local waterbody or stream?
Simple observations of benthic macroinvertebrate presences can also be used to analyze the ecological health of bodies of water. Benthic macroinvertebrates are animals that are big enough (macro) to be seen with the naked eye. They lack backbones (invertebrate) and live at least part of their lives in or on the bottom (benthos) of a body of water.
Benthic macroinvertebrates include aquatic insects (such as mayflies, stoneflies, caddisflies, midges, beetles), snails, worms, freshwater clams, mussels, and crayfish. Some species are more tolerant of pollution, while others cannot live where there is pollution.
It is easy for citizens to become involved in ecological monitoring or participate in a stream clean-up of local water bodies.


If you’re interested in such activities contact your local Soil & Water Conservation District or Hoosier Riverwatch at http://www.in.gov/idem/riverwatch/2338.htm

Monday, November 4, 2013

Water History Lessons at the Pathway to Water Quality

Sarah Wolf is an ISDA Resource Specialist, serving Jasper, Benton, Newton, and Lake Counties.


The Pathway to Water Quality committee asked me to serve as a Live Interpreter, teaching water history and conservation, during the state fair to celebrate Pathway’s 20th anniversary.  Visitors enjoyed learning how to wash clothes the old fashioned way, and all the while I was teaching them how water was used 100 years ago.  

The point I wanted to get across to them was that water was often used for multiple tasks in the past, and we tend to waste a lot of water now because using water is convenient.  In the past, because water had to be carried in buckets from the well, water was conserved.  Pioneers would wash clothes with about five gallons, and then use that water to mop the floor or water their garden.  


Now we wash one load of clothes in the washing machine with about 60 gallons, and that water is not used for any other chore before sending it on to the sewage treatment plant or septic system.  The average household of three people uses an estimated 200 gallons of water every day!  

Visitors brainstormed ideas of how to use less water, and hopefully they will consider changing just one water practice in their everyday lives.  Water is a precious resource that needs to be conserved and protected, and together we can make a difference if we are mindful of how we use water!


Educators can find a water history lesson plan that I complied for 5th grade students (adaptable for younger students) at http://www.iaswcd.org/district_tools/pwq/pdfs/WHC.pdf.